本文介紹了幾個常用的Linux監控腳本,可以實現主機網卡流量、系統狀況、主機磁盤空間、CPU和內存的使用情況等方面的自動監控與報警。根據自己的需求寫出的shell腳本更能滿足需求,更能細化主機監控的全面性。
AD:
最近時不時有互聯網的朋友問我關於服務器監控方面的問題,問常用的服務器監控除了用開源軟件,比如:cacti,nagios監控外是否可以自己寫shell腳本呢?根據自己的需求寫出的shell腳本更能滿足需求,更能細化主機監控的全面性。
下面是我常用的幾個主機監控的腳本,大家可以根據自己的情況再進行修改,希望能給大家一點幫助。
1、查看主機網卡流量
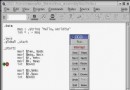
#!/bin/bash #network #Mike.Xu while : ; do time=date +%m-%d %k:%M day=date +%m-%d rx_before=ifconfig eth0|sed -n 8p|awk {print $2}|cut -c7- tx_before=ifconfig eth0|sed -n 8p|awk {print $6}|cut -c7- sleep 2 rx_after=ifconfig eth0|sed -n 8p|awk {print $2}|cut -c7- tx_after=ifconfig eth0|sed -n 8p|awk {print $6}|cut -c7- rx_result=$[(rx_after-rx_before)/256] tx_result=$[(tx_after-tx_before)/256] echo $time Now_In_Speed: $rx_resultkbps Now_OUt_Speed: $tx_resultkbps sleep 2 done
2、系統狀況監控
#!/bin/sh #systemstat.sh #Mike.Xu IP=192.168.1.227 top -n 2| grep Cpu 》./temp/cpu.txt free -m | grep Mem 》 ./temp/mem.txt df -k | grep sda1 》 ./temp/drive_sda1.txt #df -k | grep sda2 》 ./temp/drive_sda2.txt df -k | grep /mnt/storage_0 》 ./temp/mnt_storage_0.txt df -k | grep /mnt/storage_pic 》 ./temp/mnt_storage_pic.txt time=`date +%m.%d %k:%M` connect=`netstat -na | grep 219.238.148.30:80 | wc -l` echo $time $connect 》 ./temp/connect_count.txt
3、監控主機的磁盤空間,當使用空間超過90%就通過發mail來發警告
#!/bin/bash #monitor available disk space SPACE=df | sed -n / \ / $ / p | gawk {print $5} | sed s/%// if [ $SPACE -ge 90 ] then [email protected] fi
4、 監控CPU和內存的使用情況
#!/bin/bash #script to capture system statistics OUTFILE=/home/xu/capstats.csv
DATE=date +%m/%d/%Y
TIME=date +%k:%m:%s
TIMEOUT=uptime
VMOUT=vmstat 1 2
USERS=echo $TIMEOUT | gawk {print $4}
LOAD=echo $TIMEOUT | gawk {print $9} | sed s/,//
FREE=echo $VMOUT | sed -n /[0-9]/p | sed -n 2p | gawk {print $4}
IDLE=echo $VMOUT | sed -n /[0-9]/p | sed -n 2p |gawk {print $15}
echo $DATE,$TIME,$USERS,$LOAD,$FREE,$IDLE 》 $OUTFILE
5、全方位監控主機
#!/bin/bash # check_xu.sh # 0 * * * * /home/check_xu.sh DAT=`date +%Y%m%d` HOUR=`date +%H` DIR=/home/oslog/host_${DAT}/${HOUR} DELAY=60 COUNT=60 # whether the responsible directory exist if ! test -d ${DIR} then /bin/mkdir -p ${DIR} fi # general check export TERM=linux /usr/bin/top -b -d ${DELAY} -n ${COUNT} > ${DIR}/top_${DAT}.log 2>&1 & # cpu check /usr/bin/sar -u ${DELAY} ${COUNT} > ${DIR}/cpu_${DAT}.log 2>&1 & #/usr/bin/mpstat -P 0 ${DELAY} ${COUNT} > ${DIR}/cpu_0_${DAT}.log 2>&1 & #/usr/bin/mpstat -P 1 ${DELAY} ${COUNT} > ${DIR}/cpu_1_${DAT}.log 2>&1 & # memory check /usr/bin/vmstat ${DELAY} ${COUNT} > ${DIR}/vmstat_${DAT}.log 2>&1 & # I/O check /usr/bin/iostat ${DELAY} ${COUNT} > ${DIR}/iostat_${DAT}.log 2>&1 & # network check /usr/bin/sar -n DEV ${DELAY} ${COUNT} > ${DIR}/net_${DAT}.log 2>&1 & #/usr/bin/sar -n EDEV ${DELAY} ${COUNT} > ${DIR}/net_edev_${DAT}.log 2>&1 &
放在crontab裡每小時自動執行:
0 * * * * /home/check_xu.sh
這樣會在/home/oslog/host_yyyymmdd/hh目錄下生成各小時cpu、內存、網絡,IO的統計數據。
如果某個時間段產生問題了,就可以去看對應的日志信息,看看當時的主機性能如何。